|
|
|
This video produced by the National Oceanic and Atmospheric Association (NOAA) is astounding. It provides CO2 data from Antarctic Ice Cores and present day atmospheric measurements on the same graph with time in a time-lapsed state.
As you watch the video, you will notice it begins with CO2 concentrations rising in the last 100 years. You will notice seasonal fluctuations in CO2 in areas of the earth where vegetation growing season alternates with winter seasons. However, you will also notice that CO2 concentrations in Antarctica have the least fluctuation, and steadily rise over time. This is why Antarctica is an excellent place to obtain current, reliable CO2 measurements giving us the best indicator of average CO2 in the Earth atmosphere. As this amazing video progresses, it then moves back into Earth history, plotting the data derived from Antarctic ice cores. Adding the data in this way, we gain some perspective of the enormous difference between current CO2 concentrations (400 ppm in May 2013) to the past maximum CO2 concentration of 300 ppm for the past 800,000 years. This difference is staggering. The sudden, recent rise in CO2 over just 200 years has huge implications in global warming from which we are just beginning to see, as the atmosphere is only beginning to adjust. How can we possibly think that such a rapid rise in CO2 over such a short period of Earth history will not have staggering implications on Earth's climate? We need to understand this and move away from energy produced from burning of fossil fuels before the Earth begins a runaway Greenhouse Effect which has occurred on other planets. Maddalena Environmental Inc. Al Maddalena 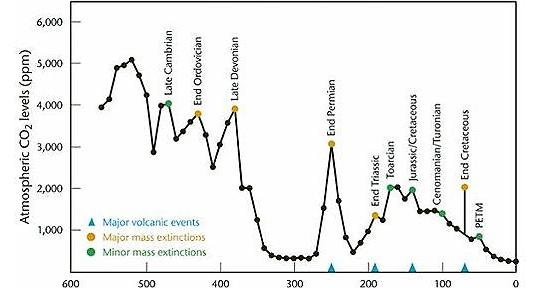 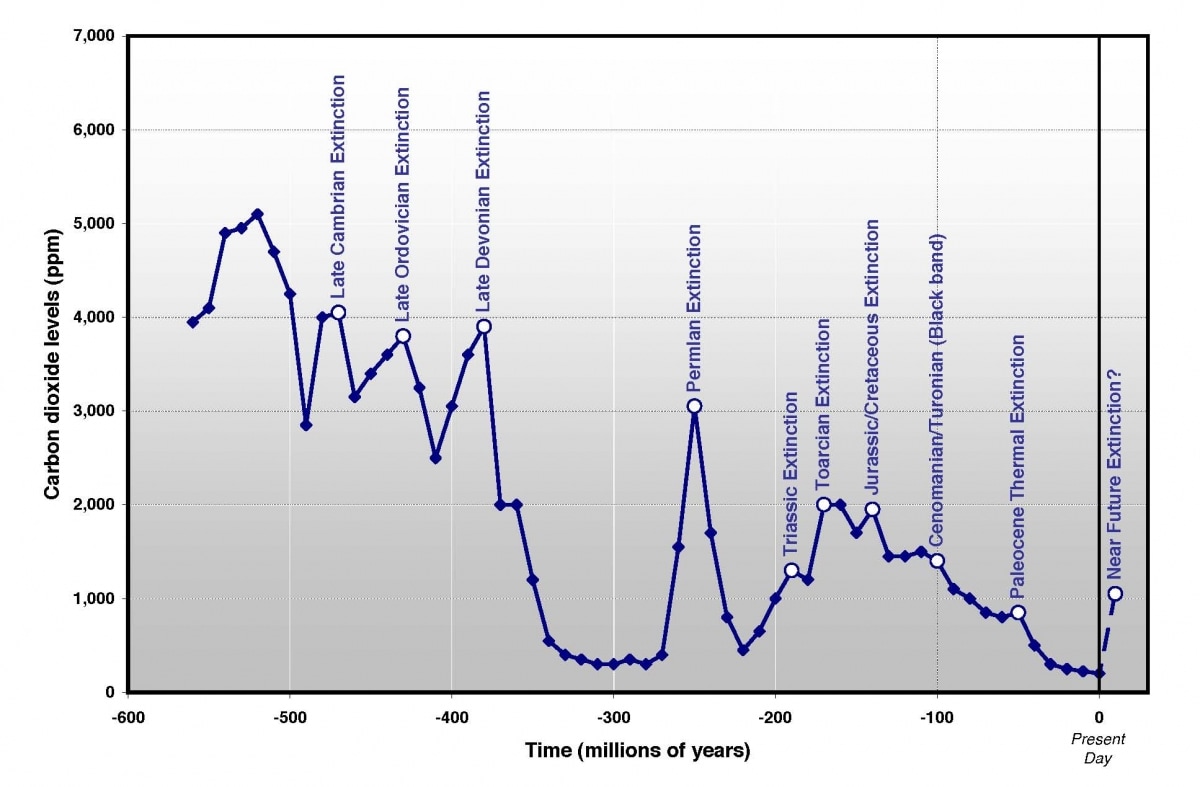 The top graphs show the major extinction events corresponding with average CO2 concentration. As you can see, the Permian is marked by a major volcanic event, which coincided with high atmospheric CO2. During this event very high atmospheric CO2 (3,000 ppm) would have created a runaway Greenhouse Effect.
This would have heated the Earth's oceans to the point where they could no longer contain dissolved oxygen. Warm water holds less dissolved gas than cold water. Therefore, it is postulated that the Permian oceans became extremely warmed and devoid of oxygen. This environment is perfect for sulphur creating anaerobic bacteria. Sulphur could combine with hydrogen creating hydrogen sulphide. An ocean containing high levels of bacteria creating hydrogen sulphide would kill most of its inhabitants. Continued heating of the ocean could also degas hydrogen sulphide from the ocean into the atmosphere. This theory is thought to cause the Permian Extinction that was responsible for killing 95% of all life on Earth at the time, both in the ocean and on land. This was by far, the largest extinction in the history of the Earth. However, more data needs to be collected and supported, world-wide to support this theory. The Extinction marking the end of the Cretaceous 65 Million years ago, where Iridium is found world wide, provided conclusive evidence for an meteorite impact as the cause. Debate over the cause of the Largest Extinction in Earth History will continue until more conclusive world-wide evidence is found. This may be difficult because the Earth's crust is convected down into the mantle every 200 Million years like a conveyor belt. As the Permian Extinction occurred about 250 Million years ago, most of the rocks would have reprocessed into the Mantle by now. Maddalena Environmental Inc. Al Maddalena Climate change is occurring whether we like to admit it or not. For the 1st time in Earth history, Human activity is to blame. The data on climate change is refuted by very few scientists. Only those scientists employed by Big Oil companies and other major corporations that make huge money on mining, distributing and burning fossil fuels are the ones casting doubt on the fact that burning of fossil fuel by humans is the main cause of recent rising of CO2 in the atmosphere and subsequent Global Warming. I am going to keep showing this excellent graph of CO2 history for the last 800,000 years based on CO2 concentrations in bubbles of ice core from Antarctica with today's levels measure at Mauno Loa in Hawaii. I believe it is the best comparison of past CO2 compared to today's levels. These are astounding.
Politicians cannot deal with this. They refuse to do anything because they claim it will tank the economy and they do not want to be the “harbingers of bad news” because that won’t get them re-elected. Politicians are only worried about short-term issues that will get them re-elected, that’s it. Nobody wants to put their names, reputations and jobs on the line for the good of man-kind. Just read the list of inactivity below, compliments of the Toronto Sun columnist Lorrie Goldstein: Canada along with most of the world’s countries missed another informal UN deadline on March 31, 2015 by not providing publically how much it is prepared to lower greenhouse gas emissions. President Obama repeated a pledge to cut U.S. emissions by 26-28% below 2005 levels by 2025. The Obama administration also announced that it was on-track to cut emissions by 80% by 2050. This is nothing but smoke and mirrors because Obama will not be in power in 2050, so he won’t be blamed when it is missed. And whoever is in power at that time will blame the former administration for setting unrealistic goals and they’ll start again. In addition, these targets are a farce because the U.S. has now become a world’s largest producer of oil through fracking for it’s own use and continues to mine coal for export at record levels, both of which produce huge greenhouse gas emissions. Other Politicians False Targets Brian Mulroney administration in 1988 pledged to lower Canada’s emissions to 20% below 1988 levels by 2005 and then did nothing to achieve this goal. Then the Conservatives lost power and the Jean Chretien administration in 1993 pledged to reduce Canada’s emissions to 20% below 1988 levels by 2005 and then also did nothing to achieve this. Jean Chretien then revised our commitment of “inaction” by signing the Kyoto Accord in 1997 to reduce our emissions to an average of 6% below 1990 levels between 2008-2012, again without doing anything to achieve this. And now Stephen Harper administration is in power while emissions are 30% over the Kyoto Accord limits and he could easily say, that meeting those Kyoto targets he would have to tank the Canadian economy. So he has committed Canada to reduce Canada’s emissions to 17% below 2005 levels by 2020. Of course Stephen Harper will not be in power by 2020 and whoever comes into power will just blame the former administration. Climate change is coming and politicians won’t deal with it. We need to make them understand that if serious greenhouse gas emission controls are not adopted by the biggest Greenhouse Gas emitters (#1-China 23.4% of World Greenhouse Gas Emissions, #2-U.S 14.7%) that greenhouse gas emissions can soon become out of control, and all scientists world-wide know what that would mean....just look at Venus. Maddalena Environmental Inc. Al Maddalena 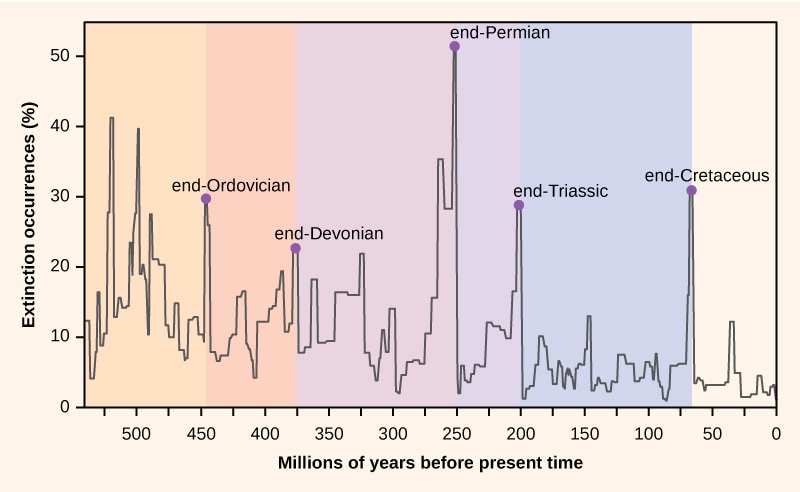  images courtesy of robertscribbler.com and johnenglander.net
If we look at the Earth geologic record, one thing is extremely obvious. There have been numerous Extinction Level Events and they have occurred with frightening regularity. The top graph is a plot of time versus % of known species extinctions. What is shockingly evident, is the regularity at which extinctions have occurred. The large extinctions are most evident, but if you look a little closer you will note there has been an extinction level event approximately every 25-30 million years. This frightening regularity for extinction level events suggests there is a single cause for this 25-30 million year cycle. While some extinctions have been explained, the cause for most of them is still unknown. For example, the extinction of the dinosaurs 65 million years ago (End of the Cretaceous) has been shown to be the result of an asteroid impact in the Yucatan Peninsula. The extinction at the End of the Permian (largest extinction level event) was known to be numerous volcanic eruptions followed by runaway greenhouse effect and sulphur dioxide levels in the oceans to build to toxic levels. These are only 2 events out of the numerous events shown in the graph. Some scientists now suggest that the 25-30 million year extinction cycle is caused by a rogue gas giant planet that follows an enormous elliptical orbit around our Sun whose orbit is approximately 25-30 million years to complete. Whenever it comes close to the Sun, its gravity can disrupt neighbouring asteroids and draw them towards our Solar System. However, this rogue Planet X has yet to be discovered. Some scientists argue that it is the path of the our solar system through the Milky Way Galaxy that causes these 25-30 million year extinctions cycles because each time it passes through the north end of the galaxy our Solar System gets hit with a significant increase in cosmic rays that can cause massive weather changes on Earth. Still some other scientists argue that Dark Matter is the culprit, because our Solar System’s path goes through areas of space containing large amounts of Dark Matter that can change the paths of asteroids and comets hurling them at Earth. However, we only know of 1 asteroid impact proven to cause an extinction and the most massive extinction was likely caused by massive volcanic eruptions. There is no evidence that all the other smaller extinctions were caused by asteroid impacts. For example, the second graph shows huge amounts of CO2 were present during many of the extinction level events. Asteroids would not normally be the cause of the release of massive amounts of CO2 in the atmosphere. While the debate of the regular 25-30 million year extinction cycle will continue for many years, further space telescope data (from GAIA-European Space Agency) combined with continued geological work should prove very interesting in the coming years. Maddalena Environmental Inc. Al Maddalena 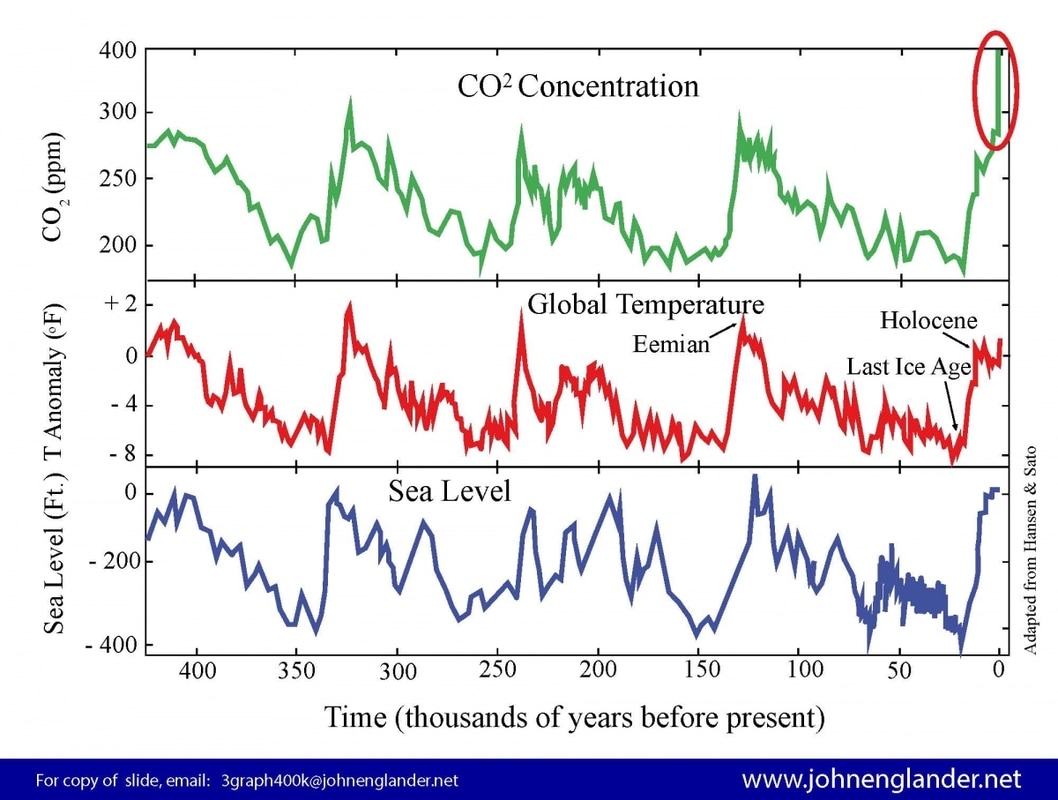 This is a comparison of the CO2 concentrations measured in air bubbles frozen in the ice cores of Antarctica dating back 400,000 years to past sea levels. You can see that every rise in CO2 has a corresponding rise in sea level that is significant.
This is because with every great rise in CO2 in the atmosphere, there was a corresponding Global Warming Greenhouse Affect causing glacial and ice cap melting. If the CO2 rise was significant enough, Global Warming was enough to completely melt the ice caps raising sea levels more than 100m (greater than 300 feet). Keep in mind that the rise in sea level during these inter-glacial warming periods was achieved with CO2 concentrations below 300 ppm. In a previous blog post, I showed you that an average of 400 ppm atmospheric CO2 was recorded in Hawaii and with the current rate of fossil fuel consumption, it is likely to head much higher. With CO2 concentrations heading higher than 400m what massive sea level rise can we expect? Well, judging by the past 800,000 years of data, sea level rise is likely to be massive, and likely to be higher than ever recorded because we are surpassing even 400 ppm in the coming years. Higher sea levels also bring, bigger storms and higher associated storm surges. Maddalena Environmental Inc. Al Maddalena |
 RSS Feed